


After a tumultuous year marked by high interest rates, inflation, and multiple rounds of layoffs, many economists had pessimistic forecasts for 2023, some all but guaranteeing a recession. Despite interest rates reaching a 22-year high at the end of 2023, the U.S. economy defied expectations and continued to grow. According to the Bureau of Economic Analysis, consumer spending was a significant factor driving economic growth, reporting a 4.2% increase in disposable income in the U.S. in the fourth quarter of 2023.
While retail spending continues to show strength, rising costs are beginning to take their toll. Although disposable income—or the income remaining after taxes—showed an overall increase in 2023, the personal savings rate—or the percentage of disposable income saved—decreased overall, indicating that Americans are spending more and saving less.
Change in the Personal Savings Rate and Inflation Rate Over Time
The personal savings dropped below historic norms as inflation remains persistently elevated
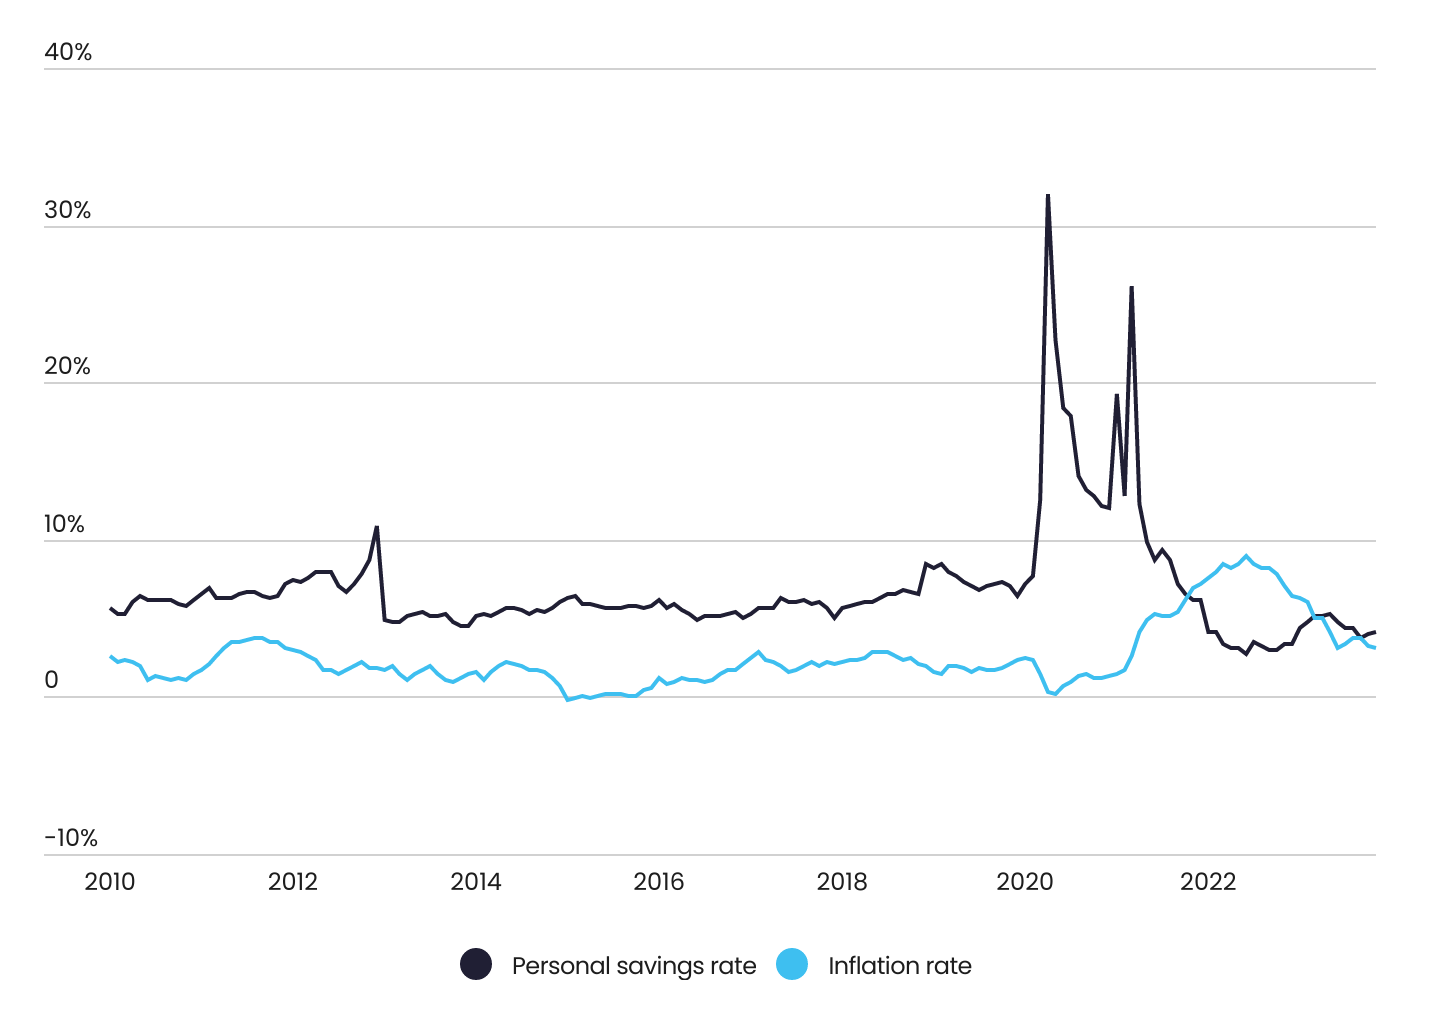
Source: Captain Experiences analysis of data from the Bureau of Economic Analysis and U.S. Bureau of Labor Statistics | Image Credit: Captain Experiences
Personal savings reached record highs during the early months of the COVID-19 pandemic, as Americans curbed spending while government programs provided additional financial support. However, as the economy reopened, a combination of pent-up consumer demand, supply chain issues, and labor shortages sent prices soaring. As Americans struggled to keep pace with rising costs, personal savings dropped sharply. Between April of 2020 and June of 2022, the personal savings rate dropped by more than 29 percentage points to a low of just 2.7%.
While rapidly rising interest rates have since helped tamp down inflation, personal savings still haven’t rebounded to pre-pandemic levels, highlighting the long-lasting impact of inflated costs and current spending habits.
Self-Estimated Minimum Family Income Requirement Changes Over Time
After inflation set in, the American perception of affordability has shifted
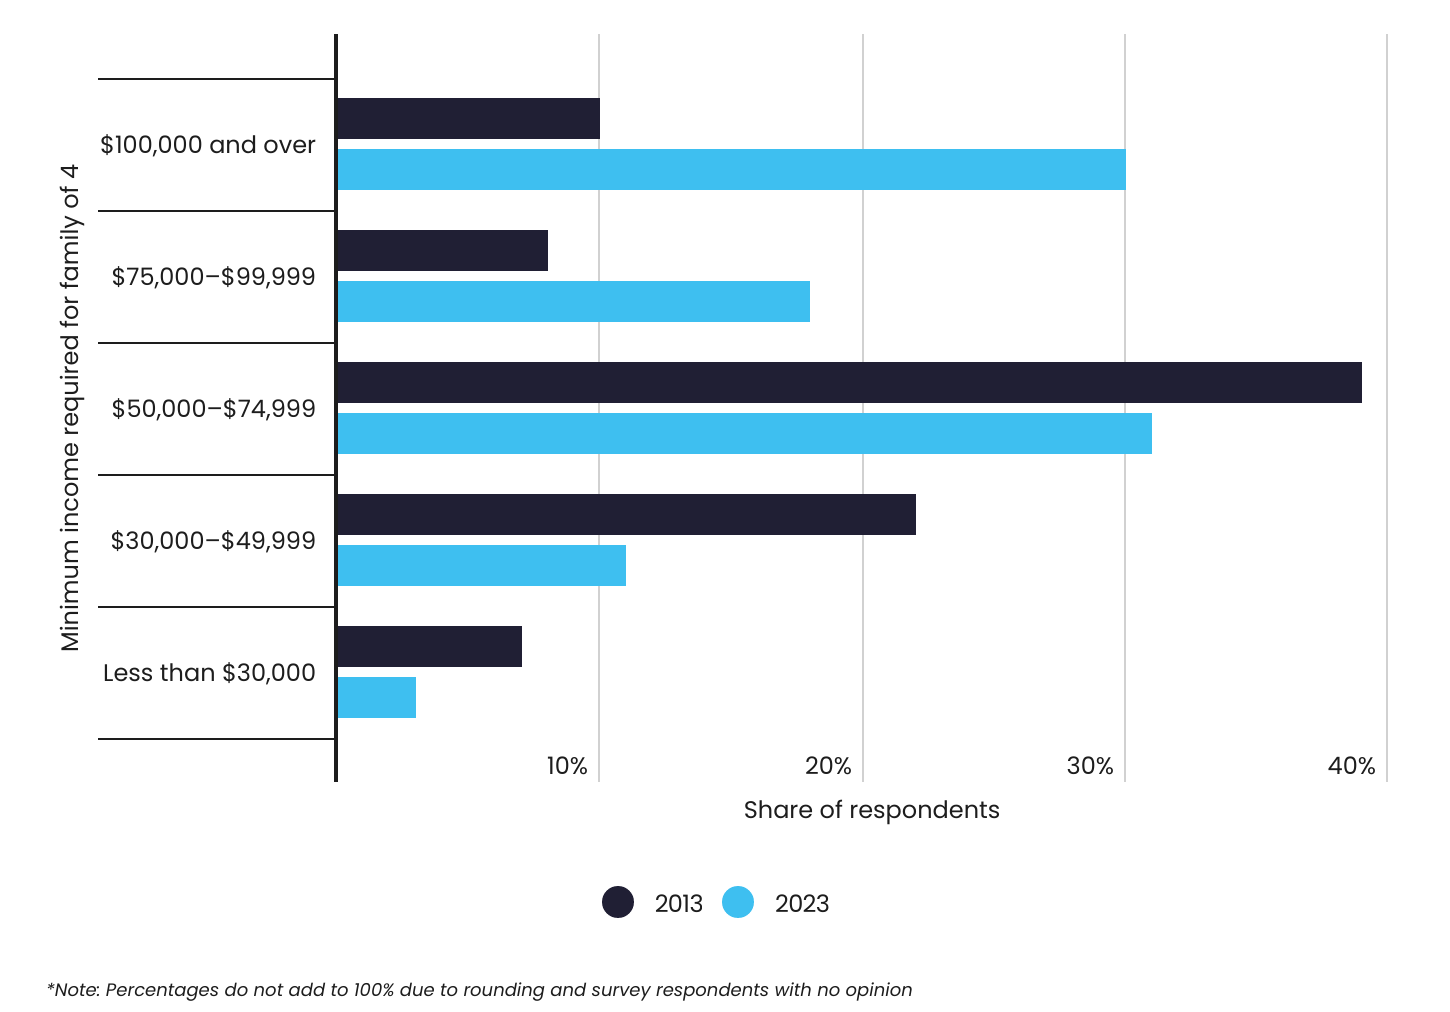
Source: Captain Experiences analysis of Gallup Poll Social Series data | Image Credit: Captain Experiences
Despite a strong job market and low unemployment rate, Americans are still struggling to keep up with the rising cost of living. In the past decade, Americans’ opinions around affordability have changed dramatically, with many feeling like they need to earn significantly more than previous years to live comfortably. In 2013, more than two-thirds of Americans estimated they could support a family of four with an annual household income of $75,000 or less. By 2023, less than half of Americans agreed. In fact, 30% of Americans estimate $100,000 to be the minimum income requirement to comfortably raise a family of four in 2023, compared to just 10% in 2013.
Changes in Household Spending From a Year Ago
While households increased their spending on recreation and health from last year, they cut back on dining out and foreign travel
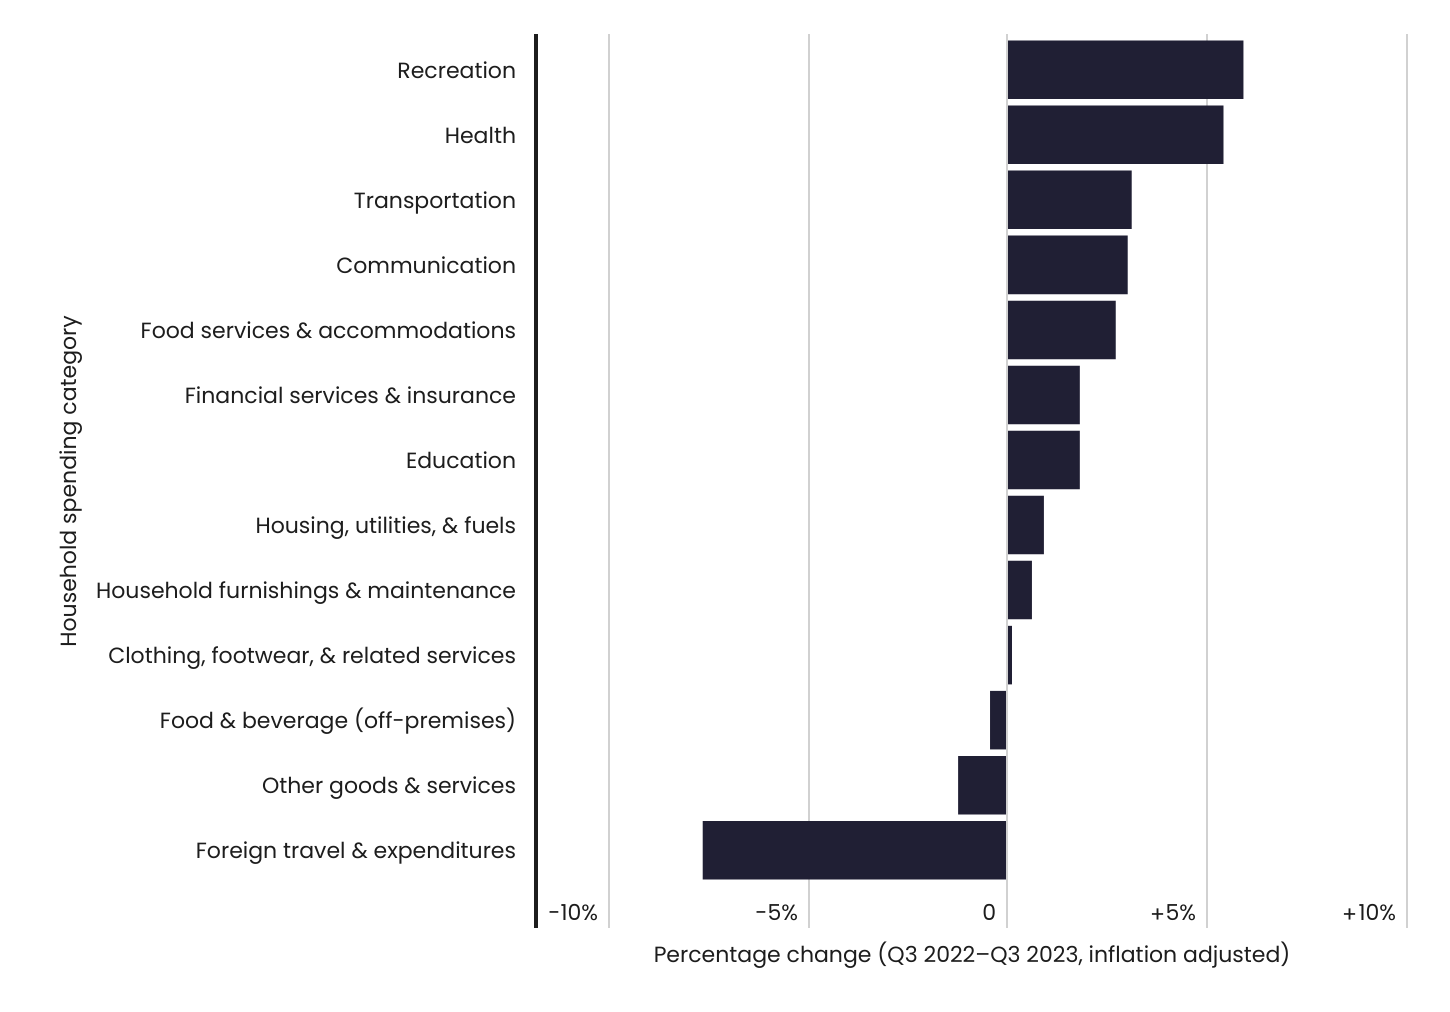
Source: Captain Experiences analysis of Bureau of Economic Analysis data | Image Credit: Captain Experiences
As disposable income and personal savings rates changed in the U.S., so did household spending habits. Priorities shifted, with foreign travel and dining out taking a backseat to spending on recreational activities and health. Compared to a year ago, spending on recreation increased 5.9% in Q3 2023, while health spending increased by 5.4% when adjusted for inflation. In the same timeframe, spending on foreign travel decreased by 7.6%, while expenses reserved for dining out decreased 0.4%. Along with recreation and health, spending on transportation also rose by 3.1%.
In the U.S., disposable income varies geographically. Since many factors like the local cost of living and interest rates can affect an individual’s disposable income, residents in certain parts of the country fare better than others. Many states in the Great Plains region—known for a lower cost of living than average—have high levels of disposable income. Five out of the top six states are located in this region, led by North Dakota with a cost-of-living adjusted, after-tax income of $71,444 per capita. On the other hand, Hawaii ranks last with an adjusted after-tax income per capita of only $47,894. Select areas of the Deep South, like Mississippi and Georgia, also have some of the lowest levels of disposable income in the country.
Below is a complete breakdown of the areas with the least disposable income across all 50 states. The analysis was conducted by researchers at Captain Experiences using data from the Bureau of Economic Analysis. For more information on how each statistic was computed, refer to the methodology section below.

Photo Credit: Andrew Zarivny / Shutterstock
15. Utah
- After-tax income per capita (adjusted): $53,990
- After-tax income per capita: $51,005
- Before-tax income per capita: $59,457
- Personal taxes paid per capita: $8,452
- Cost of living (compared to average): -5.5%

Photo Credit: John Couture / Shutterstock
14. North Carolina
- After-tax income per capita (adjusted): $53,756
- After-tax income per capita: $50,640
- Before-tax income per capita: $58,109
- Personal taxes paid per capita: $7,469
- Cost of living (compared to average): -5.8%

Photo Credit: Henryk Sadura / Shutterstock
13. Michigan
- After-tax income per capita (adjusted): $53,187
- After-tax income per capita: $49,692
- Before-tax income per capita: $57,038
- Personal taxes paid per capita: $7,346
- Cost of living (compared to average): -6.6%

Photo Credit: Wangkun Jia / Shutterstock
12. Maine
- After-tax income per capita (adjusted): $52,570
- After-tax income per capita: $53,011
- Before-tax income per capita: $60,599
- Personal taxes paid per capita: $7,588
- Cost of living (compared to average): +0.8%

Photo Credit: Sean Pavone / Shutterstock
11. Rhode Island
- After-tax income per capita (adjusted): $52,237
- After-tax income per capita: $54,692
- Before-tax income per capita: $63,557
- Personal taxes paid per capita: $8,865
- Cost of living (compared to average): +4.7%

Photo Credit: Turtix / Shutterstock
10. New Mexico
- After-tax income per capita (adjusted): $51,960
- After-tax income per capita: $47,274
- Before-tax income per capita: $52,194
- Personal taxes paid per capita: $4,920
- Cost of living (compared to average): -9.0%

Photo Credit: Sean Pavone / Shutterstock
9. Alabama
- After-tax income per capita (adjusted): $51,549
- After-tax income per capita: $45,248
- Before-tax income per capita: $50,916
- Personal taxes paid per capita: $5,668
- Cost of living (compared to average): -12.2%

Photo Credit: Harold Stiver / Shutterstock
8. Kentucky
- After-tax income per capita (adjusted): $51,347
- After-tax income per capita: $45,882
- Before-tax income per capita: $51,921
- Personal taxes paid per capita: $6,039
- Cost of living (compared to average): -10.6%

Photo Credit: Andrew Zarivny / Shutterstock
7. Arizona
- After-tax income per capita (adjusted): $51,301
- After-tax income per capita: $51,248
- Before-tax income per capita: $58,442
- Personal taxes paid per capita: $7,194
- Cost of living (compared to average): -0.1%

Photo Credit: f11photo / Shutterstock
6. Georgia
- After-tax income per capita (adjusted): $51,048
- After-tax income per capita: $48,920
- Before-tax income per capita: $56,589
- Personal taxes paid per capita: $7,669
- Cost of living (compared to average): -4.2%

Photo Credit: Sean Pavone / Shutterstock
5. West Virginia
- After-tax income per capita (adjusted): $50,489
- After-tax income per capita: $45,059
- Before-tax income per capita: $49,993
- Personal taxes paid per capita: $4,934
- Cost of living (compared to average): -10.8%

Photo Credit: Sean Pavone / Shutterstock
4. South Carolina
- After-tax income per capita (adjusted): $50,302
- After-tax income per capita: $47,058
- Before-tax income per capita: $53,618
- Personal taxes paid per capita: $6,560
- Cost of living (compared to average): -6.4%

Photo Credit: Andrew Zarivny / Shutterstock
3. Oregon
- After-tax income per capita (adjusted): $49,809
- After-tax income per capita: $53,079
- Before-tax income per capita: $62,303
- Personal taxes paid per capita: $9,224
- Cost of living (compared to average): +6.6%

Photo Credit: Sean Pavone / Shutterstock
2. Mississippi
- After-tax income per capita (adjusted): $48,289
- After-tax income per capita: $42,170
- Before-tax income per capita: $46,370
- Personal taxes paid per capita: $4,200
- Cost of living (compared to average): -12.7%

Photo Credit: Ja-images / Shutterstock
1. Hawaii
- After-tax income per capita (adjusted): $47,894
- After-tax income per capita: $53,085
- Before-tax income per capita: $61,779
- Personal taxes paid per capita: $8,694
- Cost of living (compared to average): +10.8%
Methodology

Photo Credit: fizkes / Shutterstock
To find the locations with the least disposable income, researchers at Captain Experiences analyzed the latest data from the Bureau of Economic Analysis’ Regional Economic Accounts. The researchers ranked states according to the per capita after-tax income after adjusting for the cost of living. For additional context, the unadjusted per capita after-tax income, per capita before-tax income, per capita personal taxes paid, and cost of living were also calculated.
For complete results, see States With the Least Disposable Income on Captain Experiences.