The 2024 presidential race and recent port strikes have brought renewed focus on America’s dependence on foreign goods and U.S. trade policy more broadly. Both President Trump and Vice President Harris have signaled a shift away from long-standing support for free trade, though their approaches differ. President Trump has proposed blanket tariffs of up to 20% on all imports, with even higher rates on goods from China. Vice President Harris’s policies are less defined, but indicate potential tariff adjustments to address economic and labor concerns.
Though views on protectionist policies vary, there is general agreement that tariffs could have immediate effects on U.S. consumers, particularly when it comes to prices. Similarly, experts warned that American households would likely have experienced shortages and higher retail prices had the dockworkers strike dragged on. With inflation already straining household budgets, additional tariffs and shortages of imported goods could drive up the cost of everyday necessities, including the cost of food.
Currently, the U.S. imports nearly a fifth of its food supply from abroad, and the average American household spends nearly 14% of its annual budget on food and beverages. For many, this is already a burden—28% of U.S. adults report difficulty affording food, and 13.5% of households are classified as food insecure, meaning they lack reliable access to sufficient nutrition.
To better understand the potential impact of import tariffs and foreign good shortages on the U.S. food supply, researchers at Trace One, a company specializing in regulatory compliance for the food and beverage industry, analyzed the most recent data from the USDA, U.S. Census Bureau, and U.S. Bureau of Economic Analysis. Their focus was on tracking changes in food imports over time, examining food imports as a percentage of total consumption, identifying key trade partners, and highlighting the top imports for each state. For more information on the data sources and methodology, refer to the methodology section.
U.S. Agricultural Imports & Exports
USDA forecasts $42B agricultural trade deficit in 2025

Trace One analysis of USDA data
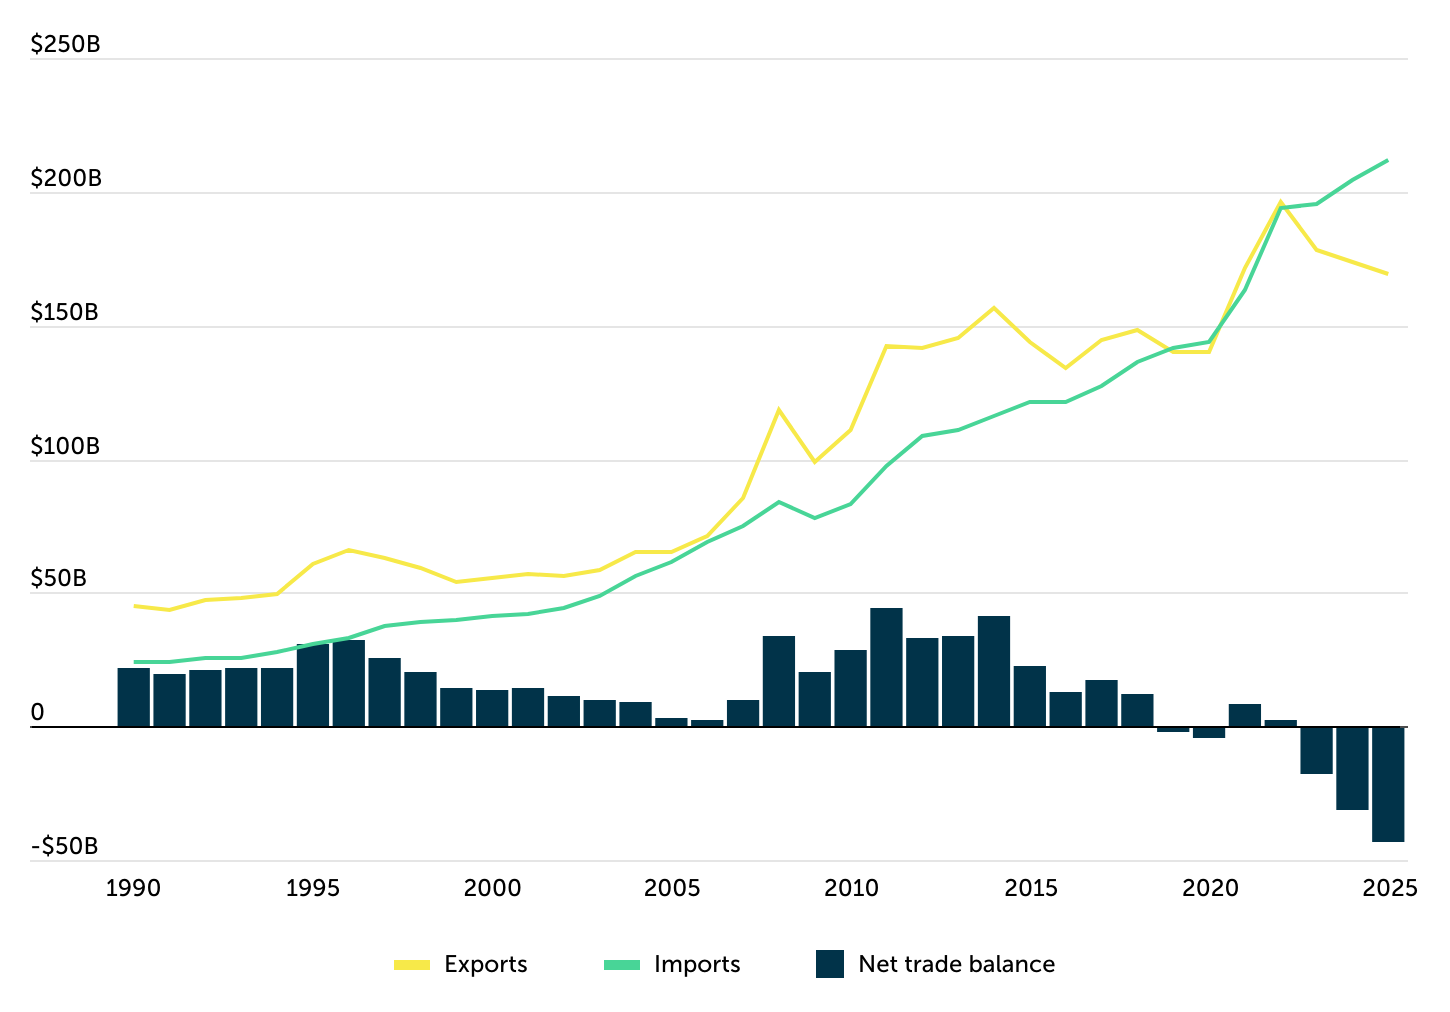
The U.S. has traditionally exported more agricultural goods than it imported, but this balance has shifted in recent years as import growth has outpaced exports. Demand for imported goods has surged, driven by factors such as a strong U.S. dollar and consumer preferences for year-round access to fresh produce.
Looking ahead, the USDA forecasts a $42 billion agricultural trade deficit in 2025, which would be the largest on record in at least the past three decades. U.S. agricultural exports are expected to decline to $169.5 billion, a $4 billion drop from the previous year, due to falling prices for key commodities like soybeans, corn, and cotton, as well as reduced beef exports. Meanwhile, agricultural imports are projected to rise to $212 billion, driven by increasing demand for produce and sugar.
Imports as a Share of Consumption by Food Category
Nearly 60% of fruits & nuts consumed in the U.S. are imported

Trace One analysis of USDA data
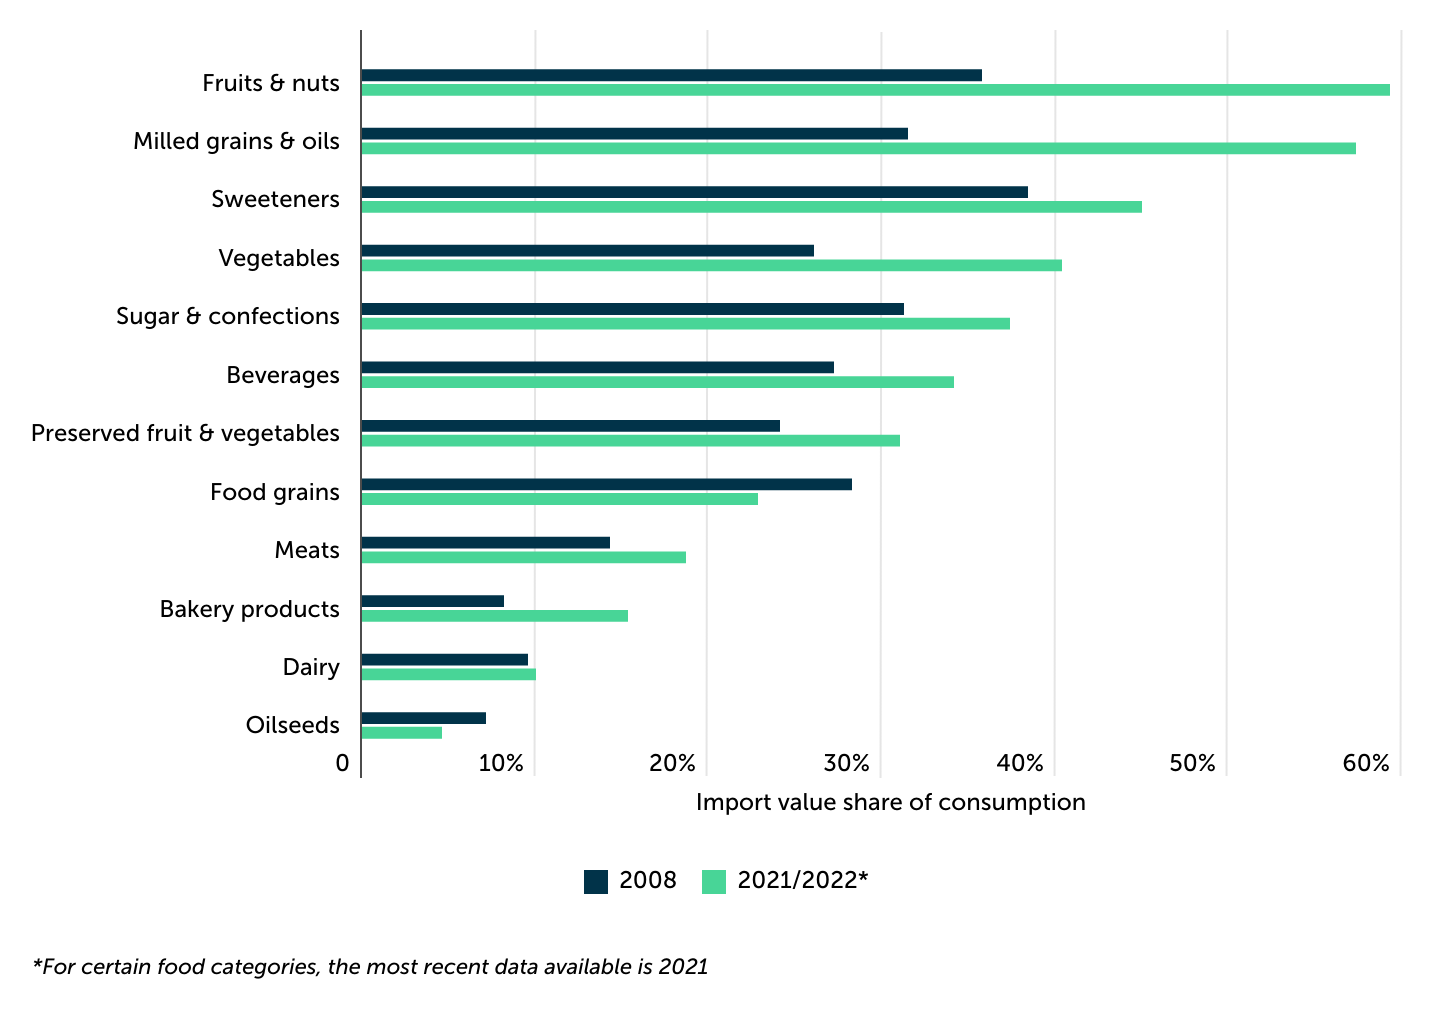
Imported foods have become an increasingly significant part of the American diet, with the share of imported goods rising across nearly every food category in recent years. Between 2008 and 2022, the percentage of total food and beverages consumed in the U.S. that were imported increased from 12.4% to 17.3%. However, this growing reliance on imported food has been particularly pronounced in certain categories.
Fruits and nuts stand out as one of the most import-dependent categories, with nearly 60% of the fruits and nuts consumed in the U.S. now coming from abroad, up from 35.8% in 2008. Similarly, imports of milled grains and oils have grown sharply, now accounting for 57.4% of consumption, compared to 31.5% in 2008. Other categories like sweeteners and vegetables have also seen notable increases, with imports now constituting 45.0% and 40.4% of consumption, respectively.
In addition to these categories, the U.S. is heavily reliant on imports for seafood, with an estimated 70–85% of seafood consumed domestically coming from international sources. As tariffs and trade policies potentially shift, these high levels of dependency on imported goods could have a direct impact on food prices at the consumer level.
Top Trade Partners & Imports
Food & beverage imports from Mexico & Canada account for 42% of the U.S. total

Trace One analysis of U.S. Census Bureau data
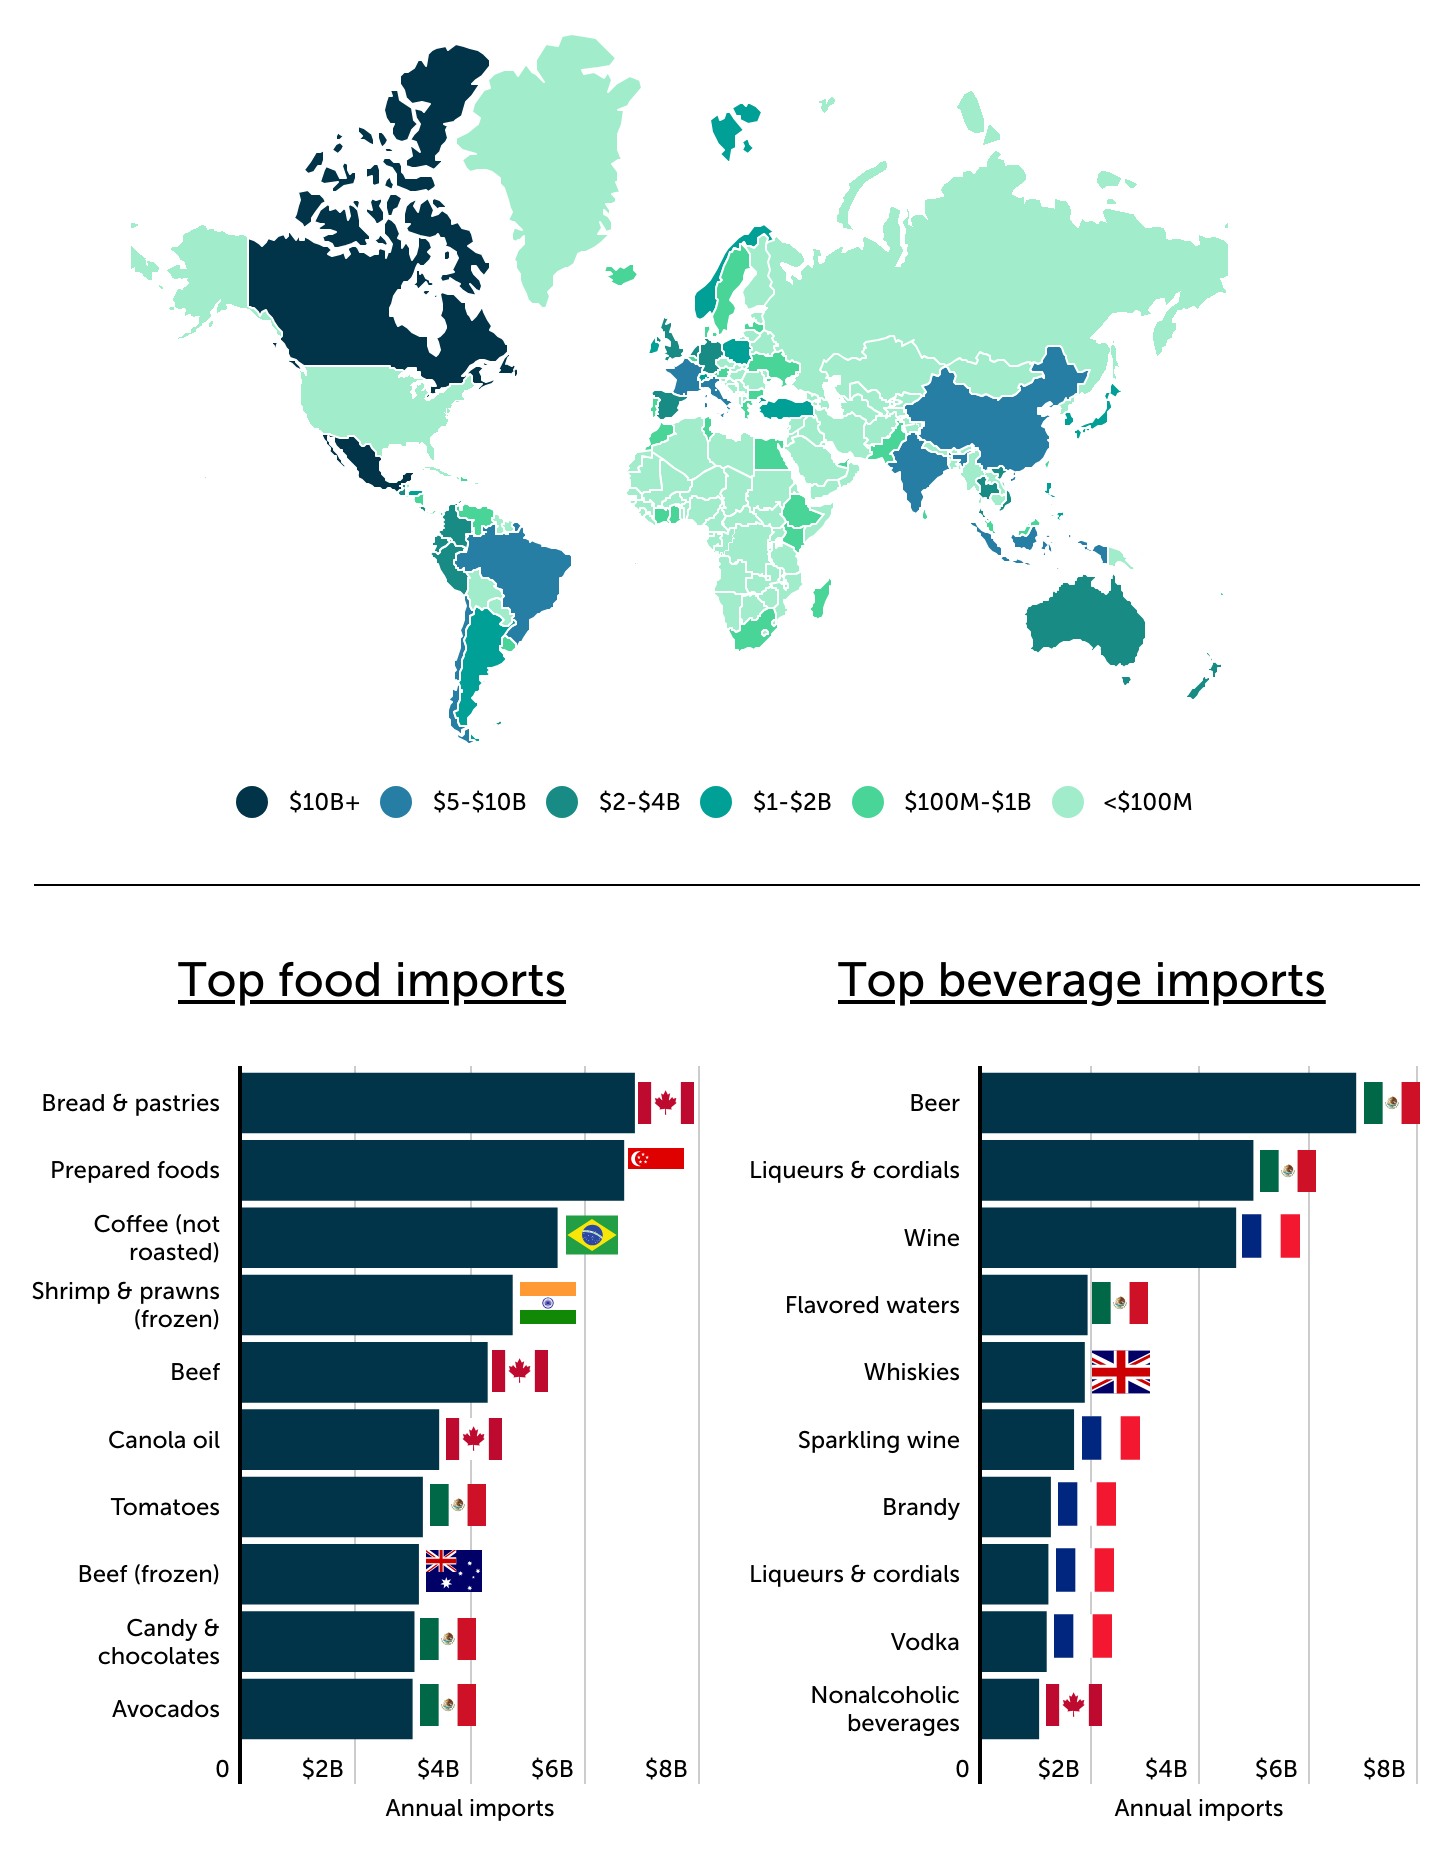
At the country level, Mexico and Canada account for 42% of total U.S. food and beverage imports. Mexico exported over $44 billion in food products to the U.S. in 2023, primarily beer, while Canada exported $38 billion, with bread and pastries as its leading category. Italy and France are among the top European exporters, with wine as their primary export to the U.S. Other significant trade partners include Chile, which supplies salmon, and Brazil, a major source of coffee.
China, India, and Indonesia are key contributors from Asia, exporting a variety of products such as oils and shrimp. Australia and New Zealand are important suppliers of beef, while countries like Peru and Vietnam export grapes and cashews, respectively.
Among specific food categories, bread and pastries are the largest import, valued at nearly $6.9 billion. Prepared foods, coffee, and frozen shrimp also rank high in value, while beer leads among beverages, followed by liqueurs, cordials, and wine.
The Top Food & Beverage Import in Every State

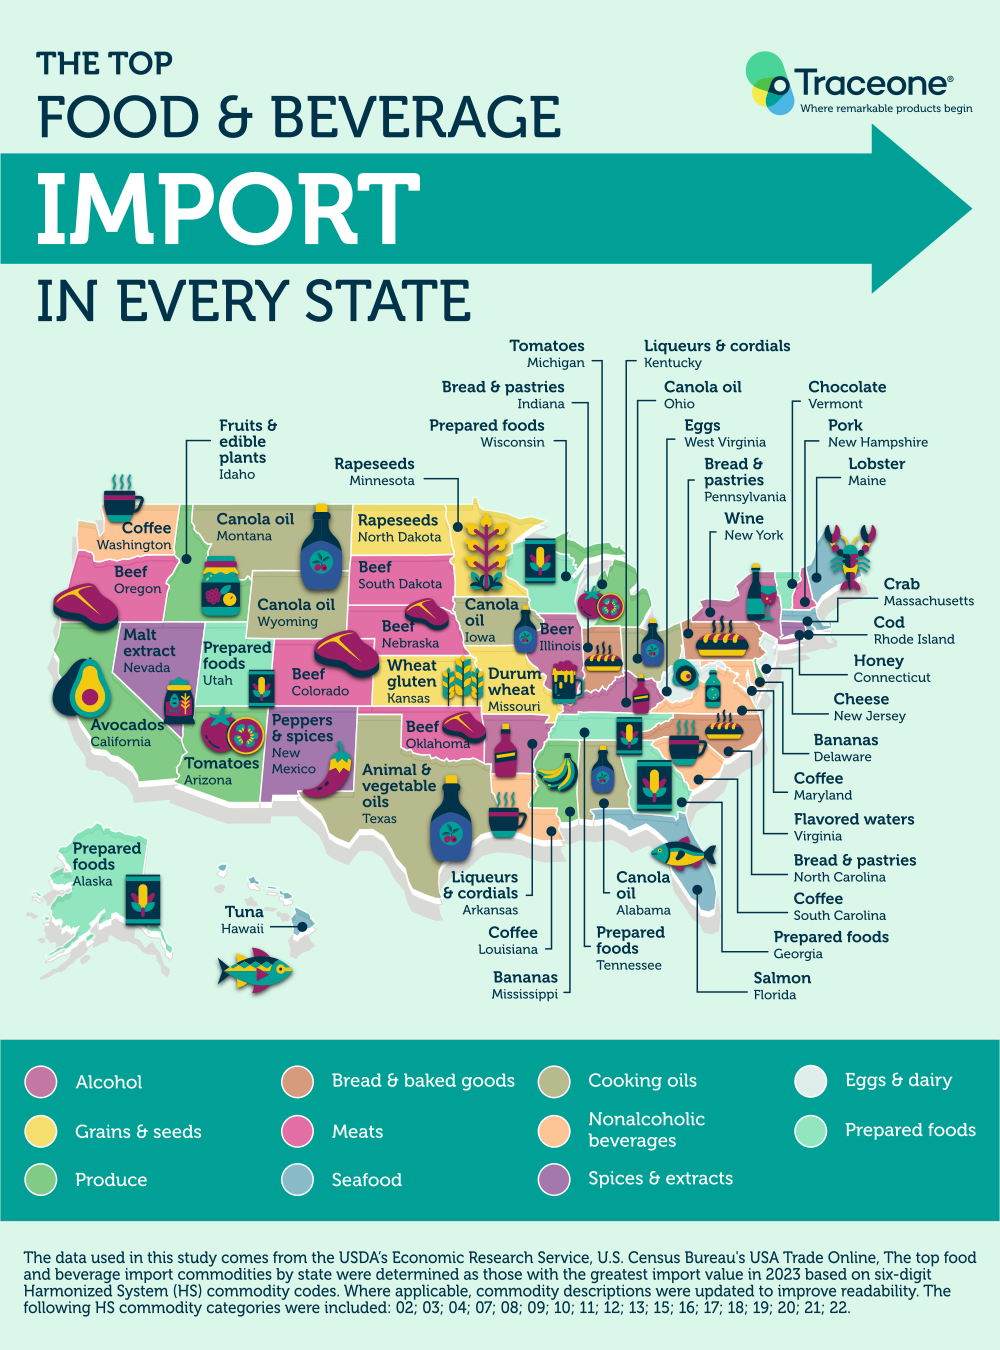
The top food and beverage imports by state vary greatly, spanning everything from cooking oils and prepared foods to meats, seafood, fresh produce, and alcohol. Prepared foods, canola oil, and beef each claim the top spot in five states. Coffee ranks as the leading import in four states, while bread and pastries dominate in three. Interestingly, despite beer being the top food and beverage import nationally, Illinois is the only state where it ranks as the number one state-level import.
Methodology

Photo Credit: Studio Concept / Shutterstock
The data used in this study comes from the USDA’s Economic Research Service, U.S. Census Bureau’s USA Trade Online, U.S. Census Bureau’s Household Pulse Survey, and U.S. Bureau of Economic Analysis’s Consumer Spending by State.
The top food and beverage import commodities for the U.S. overall, by country, and by state were determined as those with the greatest import value in 2023 based on six-digit Harmonized System (HS) commodity codes. Where applicable, commodity descriptions were updated to improve readability. The following HS commodity categories were included: 02; 03; 04; 07; 08; 09; 10; 11; 12; 13; 15; 16; 17; 18; 19; 20; 21; 22.
The percentage of adults experiencing food affordability challenges was sourced from the Household Pulse Survey Phase 4.2 Cycle 09. This figure represents the proportion of respondents who reported being unable to afford more food. State-level data on food insecurity covers the period from 2021 to 2023, while national-level data reflects conditions in 2023 alone.
For complete results, see Trade Wars & the Dinner Table: Which Foods Are Most Vulnerable to Import Tariffs? on Trace One.


